Javascript html表格画斜线
在输出html报表时,有时需要复杂表头如斜线表头,使用css控制斜线不具有通用性,所以下面介绍使用Raphael工具画斜线图,Raphael是一个用于在网页中绘制矢量图形的 Javascript库,它使用 SVG W3C标准和 VML作为创建图形的基础,你可以通过 JavaScript 操作 DOM 来轻松画出斜线。
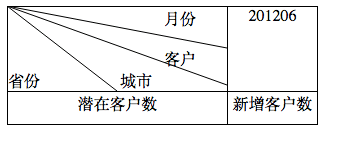
表格添加斜线
采用Raphael画线,现代浏览器会使用SVG画图,IE7、8等低版本的浏览器使用VML画图,所以最好不要直接在td中画线,这样td中的内容会被线挤到图下面,这时定义一个绝对位置的div,在div中画线,然后将div移动到td的坐标,这样也可以在表格中任何位置的td画斜线
$(function() {
  var paper = new Raphael("lineDiv"); //div中画线
  paper.path("M0,0L110,85");//坐标(0,0)(110,85)
  paper.path("M0,0L220,42");//坐标(0,0)(220,42)
  paper.path("M0,0L220,79");//坐标(0,0)(220,79)
  var offset = $("#lineTd").offset();//td的位置
   //将画线的DIV移动到td的位置
  $("#lineDiv").offset({top: offset.top, left: offset.left});
})
paper.path("M0,0L110,85"), M表示线的开始坐标位置,L表示直线,L110,85表示直线的终点坐标为(110,85)。
HTML示例
<html xmlns="http://www.w3.org/1999/xhtml" xml:lang="en" lang="en">
<head>
<meta http-equiv="Content-Type" content="text/html; charset=UTF-8" />
<script type="text/javascript" src="http://cdn.bootcss.com/jquery/1.11.3/jquery.min.js"></script>
<script type="text/javascript" src="http://cdn.bootcss.com/raphael/2.2.7/raphael.min.js"></script>
</head>
<body>
<div id="lineDiv" style='position:absolute;z-index:9999;'></div>
<table cellspacing="0" cellpadding="0" style="border-collapse:collapse;">
<tr>
<td id="lineTd" style="border:#000000 solid 1px;width:219px;height:76px;vertical-align:top;" points="[110,79,222,42,222,79]"> 月份<br> <br> 客户<br>省份 城市</td>
<td style="text-align:center;border:#000000 solid 1px;height:45px;vertical-align:top;">201206</td>
</tr>
<tr>
<td style="text-align:center;border:#000000 solid 1px;width:89px;height:32px;vertical-align:top;">潜在客户数</td>
<td style="text-align:center;border:#000000 solid 1px;width:89px;height:32px;vertical-align:top;">新增客户数</td>
</tr>
</table>
</body>
<script>
$(function() {
var paper = new Raphael("lineDiv");
paper.path("M0,0L110,85");//坐标(0,0)(110,85)
paper.path("M0,0L220,42");//坐标(0,0)(220,42)
paper.path("M0,0L220,79");//坐标(0,0)(220,79)
var offset = $("#lineTd").offset();//td的位置
//将画线的DIV移动到td的位置
$("#lineDiv").offset({top: offset.top, left: offset.left});
})
</script>
</html>