Java POI输出excel单元格画斜线
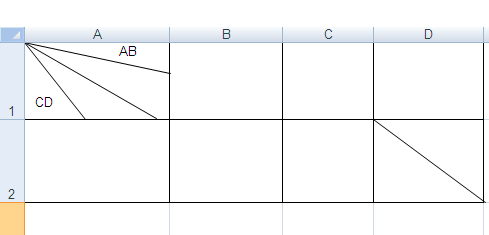
企业中有的报表比较复杂,如在表头画斜线来表示多个展示指标,poi输出excel时,支持在每个单元格中画斜线,
通过EscherGraphics2d,
对象画一些图形,斜线的坐标开始位置是相对于单元格的,所以只需要关心斜线的终止坐标位置即可。
sheet cell画斜线
1. 首先初始化HSSFWorkbook对象,通过此对象创建excel的一个名称为"line"的sheet, 下面是通过sheet对象创建单元格。
HSSFWorkbook wb = new HSSFWorkbook();
HSSFSheet sheet = wb.createSheet("line");
2. 通过sheet的createRow方法创建table的行,设置行高为77*PXTOPT, 77是像素值转换为poi高需要乘以0.75(PXTOPT),
通过row创建HSSFCell对象,为HSSFCell单元格设置样式。
HSSFRow row = sheet.createRow(0);
row.setHeightInPoints(77 * PXTOPT);
HSSFCell cell = row.createCell(0);
3. 画第一个单元格3个斜线,x1,y1,x2,y2,x3,y3为线的坐标终止位置,开始坐标是相对于当前的单元格,所以为(0,0), drawLine方法中
i表示sheet,
行数,j表示sheet的列数,width为当前单元格的宽度,height为当前单元格的高度,HSSFClientAnchor 对象是指定在哪个单元格中画线,EscherGraphics2d对象为画笔对象,画线方法 drawLine(0,0, x, y),x、y为线的终止坐标,PERCENT_WIDTH与PERCENT_HEIGHT变量为excel中单元格宽度与高度换算值,excel中单元格宽度=PERCENT_WIDTH * 0.75 * 像素宽度。
int x1 = 61, y1 = 77;
int x2 = 132, y2 = 76;
int x3 = 144, y3 = 31;
int[] xys = { x1, y1, x2, y2, x3, y3 };
drawLine(sheet, row, 0, 0, 144, 77, xys);

// draw cell line
private static void drawLine(HSSFSheet sheet, HSSFRow row, int i, int j, int width, int height,
	int[] xys) {
int cellWidth = (int) (PERCENT_WIDTH * PXTOPT * width);
short cellHeight = (short) (PERCENT_HEIGHT * PXTOPT * height);
sheet.setColumnWidth(j, cellWidth);
row.setHeight(cellHeight);

HSSFPatriarch patriarch = sheet.createDrawingPatriarch();
HSSFClientAnchor a = new HSSFClientAnchor(0, 0, 1023, 255, (short) j, i, (short) (j), i);
HSSFShapeGroup group = patriarch.createGroup(a);
float verticalPointsPerPixel = a.getAnchorHeightInPoints(sheet);
EscherGraphics g = new EscherGraphics(group, sheet.getWorkbook(), Color.black,
		verticalPointsPerPixel);
EscherGraphics2d g2d = new EscherGraphics2d(g);

for (int l = 0; l < xys.length; l += 2) {
	int x = (int) ((PERCENT_WIDTH * 0.75 * xys[l] / cellWidth) * 1023);
	int y = (int) ((PERCENT_HEIGHT * 0.75 * xys[l + 1] / cellHeight) * 255);
	g2d.drawLine(0, 0, x, y);
  }
}
4. 画最后一个单元格的一个斜线,这是i=1,j=3,第二行第四列单元格,斜线开始坐标为(0,0),终止坐标为(112,83)
int[] xys1 = { 112, 83 };
drawLine(sheet, row, 1, 3, 110, 83, xys1);
完整示例
下面是输出excel斜线完整的示例代码,使用的poi类库为:poi-3.8.jar
import java.awt.Color;
import java.io.FileOutputStream;

import org.apache.poi.hssf.usermodel.EscherGraphics;
import org.apache.poi.hssf.usermodel.EscherGraphics2d;
import org.apache.poi.hssf.usermodel.HSSFCell;
import org.apache.poi.hssf.usermodel.HSSFCellStyle;
import org.apache.poi.hssf.usermodel.HSSFClientAnchor;
import org.apache.poi.hssf.usermodel.HSSFPalette;
import org.apache.poi.hssf.usermodel.HSSFPatriarch;
import org.apache.poi.hssf.usermodel.HSSFRow;
import org.apache.poi.hssf.usermodel.HSSFShapeGroup;
import org.apache.poi.hssf.usermodel.HSSFSheet;
import org.apache.poi.hssf.usermodel.HSSFWorkbook;

public class TestExcel {

    public static final int PERCENT_WIDTH = 50;
    public static final int PERCENT_HEIGHT = 20;

    public static final float PXTOPT = 0.75f;

    public static void main(String[] args) throws Exception {
        FileOutputStream fos = new FileOutputStream("D:/line.xls");
        HSSFWorkbook wb = new HSSFWorkbook();
        HSSFSheet sheet = wb.createSheet("line");

        HSSFRow row = sheet.createRow(0);
        row.setHeightInPoints(77 * PXTOPT);

        final String text = "                       AB\n\n\n CD";
        HSSFCell cell = row.createCell(0);
        HSSFCellStyle cellStyle = getCellFormat(wb);
        int x1 = 61, y1 = 77;
        int x2 = 132, y2 = 76;
        int x3 = 144, y3 = 31;
        int[] xys = { x1, y1, x2, y2, x3, y3 };
        drawLine(sheet, row, 0, 0, 144, 77, xys);
        cell.setCellValue(text);
        cellStyle.setVerticalAlignment(HSSFCellStyle.VERTICAL_TOP);
        cell.setCellStyle(cellStyle);

        cell = row.createCell(1);
        cell.setCellStyle(cellStyle);

        cell = row.createCell(2);
        cell.setCellStyle(cellStyle);

        cell = row.createCell(3);
        cell.setCellStyle(cellStyle);

        row = sheet.createRow(1);
        row.setHeightInPoints(83 * PXTOPT);
        cell = row.createCell(0);
        cell.setCellStyle(cellStyle);

        cell = row.createCell(1);
        cell.setCellStyle(cellStyle);

        cell = row.createCell(2);
        cell.setCellStyle(cellStyle);

        cell = row.createCell(3);
        cell.setCellStyle(cellStyle);

        int[] xys1 = { 112, 83 };
        drawLine(sheet, row, 1, 3, 110, 83, xys1);

        wb.write(fos);
    }

    // draw cell line
    private static void drawLine(HSSFSheet sheet, HSSFRow row, int i, int j, int width, int height,
            int[] xys) {
        int cellWidth = (int) (PERCENT_WIDTH * PXTOPT * width);
        short cellHeight = (short) (PERCENT_HEIGHT * PXTOPT * height);
        sheet.setColumnWidth(j, cellWidth);
        row.setHeight(cellHeight);

        HSSFPatriarch patriarch = sheet.createDrawingPatriarch();
        HSSFClientAnchor a = new HSSFClientAnchor(0, 0, 1023, 255, (short) j, i, (short) (j), i);
        HSSFShapeGroup group = patriarch.createGroup(a);
        float verticalPointsPerPixel = a.getAnchorHeightInPoints(sheet);
        EscherGraphics g = new EscherGraphics(group, sheet.getWorkbook(), Color.black,
                verticalPointsPerPixel);
        EscherGraphics2d g2d = new EscherGraphics2d(g);

        for (int l = 0; l < xys.length; l += 2) {
            int x = (int) ((PERCENT_WIDTH * 0.75 * xys[l] / cellWidth) * 1023);
            int y = (int) ((PERCENT_HEIGHT * 0.75 * xys[l + 1] / cellHeight) * 255);
            g2d.drawLine(0, 0, x, y);
        }
    }

    public static HSSFCellStyle getCellFormat(HSSFWorkbook wb) {
        HSSFCellStyle cellStyle = wb.createCellStyle();
        if (cellStyle.getBorderBottom() != HSSFCellStyle.BORDER_THIN) {
            cellStyle.setBorderBottom(HSSFCellStyle.BORDER_THIN);
        }
        if (cellStyle.getBorderLeft() != HSSFCellStyle.BORDER_THIN) {
            cellStyle.setBorderLeft(HSSFCellStyle.BORDER_THIN);
        }
        if (cellStyle.getBorderTop() != HSSFCellStyle.BORDER_THIN) {
            cellStyle.setBorderTop(HSSFCellStyle.BORDER_THIN);
        }
        if (cellStyle.getBorderRight() != HSSFCellStyle.BORDER_THIN) {
            cellStyle.setBorderRight(HSSFCellStyle.BORDER_THIN);
        }
        cellStyle.setBottomBorderColor(createPette(wb));
        cellStyle.setLeftBorderColor(createPette(wb));
        cellStyle.setRightBorderColor(createPette(wb));
        cellStyle.setTopBorderColor(createPette(wb));
        return cellStyle;
    }

    public static short createPette(HSSFWorkbook wb) {
        short petteIndex = 0;
        Color rgb = new Color(0x00, 0x00, 0x00);
        HSSFPalette palette = wb.getCustomPalette();
        palette.setColorAtIndex(petteIndex, (byte) rgb.getRed(), (byte) rgb.getGreen(), (byte) rgb
                .getBlue());
        return petteIndex;
    }
}